AI-generated TLDR
Google’s share of total traffic has plunged from 80 % in May 2024 to just 30 % today, underscoring how quickly organic visibility can erode when competitors refine their SEO. The Model Context Protocol, or MCP, is designed to react to that shift by linking Google Search Console and Google Analytics data directly to artificial‑intelligence engines. To make MCP operational, you must enable the Google Search Console API and the Google Analytics Reporting API 4, after which the tool surfaces actionable insights—such as keyword opportunities, CTR trends, and site health metrics—allowing marketers to pivot strategies before traffic slips further. It...
I remember the days when I’d spend two hours every Wednesday morning doing data analysis.
Pull data from Google Search Console. Export traffic numbers from Google Analytics. Copy-paste everything into Spreadsheets. Build charts.
I eventually started automating reports, but the grunt work never really ended. There had to be a better solution.
Let me introduce you to: Model Context Protocol (MCP).
Here’s what it does: Connects AI directly to your Google Analytics or Search Console data, allowing you to ask questions in plain English and get real answers.
Instead of exporting CSVs, you can now ask: “Which pages lost traffic last month and why?”
The AI pulls the data, finds patterns, and gives you actual insights.
Not just numbers, explanations as well!
What is MCP?
MCP lets AI tools access your SEO accounts’ data directly. It’s an integration tool that sits between your data and the LLM you use.
It allows you to funnel all your data through AI. Ask it questions, analyze it, visualize it.
Here is an example:
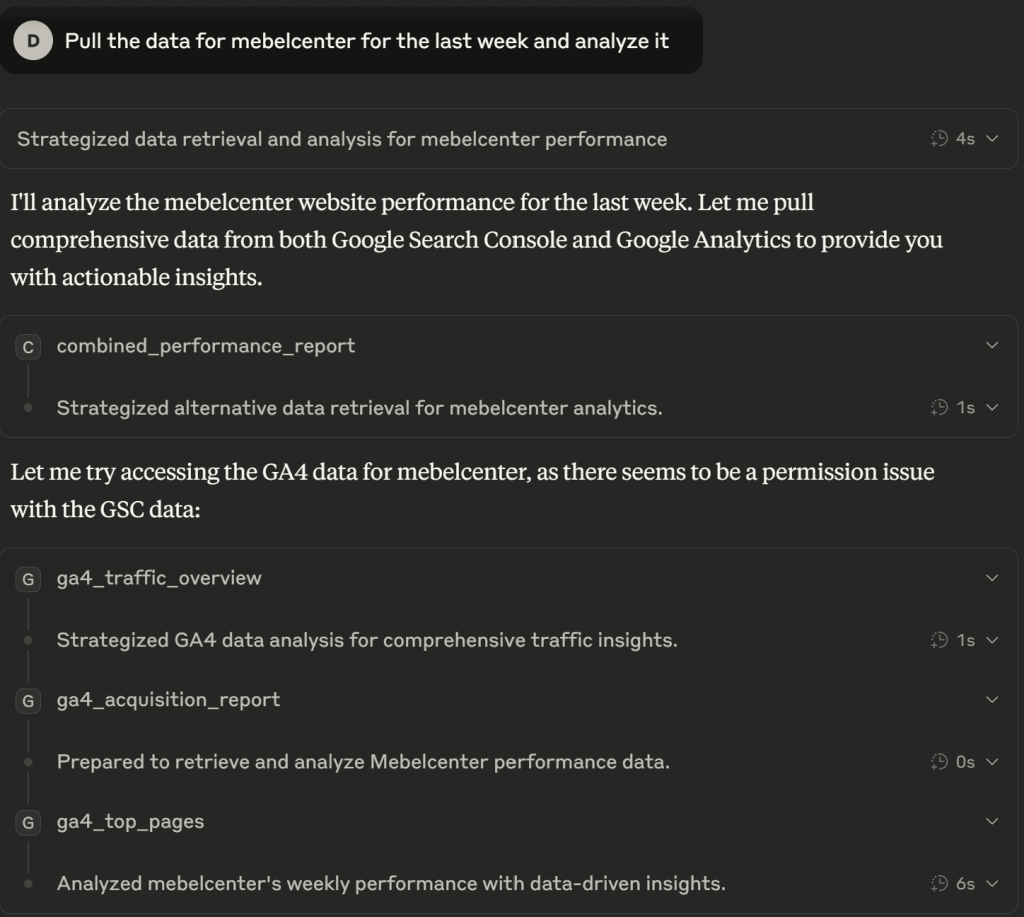
Pulling the data from GA and analyzing itHere’s the reportThe difference is massive. You now have access to all types of insight. You can do whatever you want with the data and combine it in unimaginable ways, and the best part of it – it only takes a few minutes
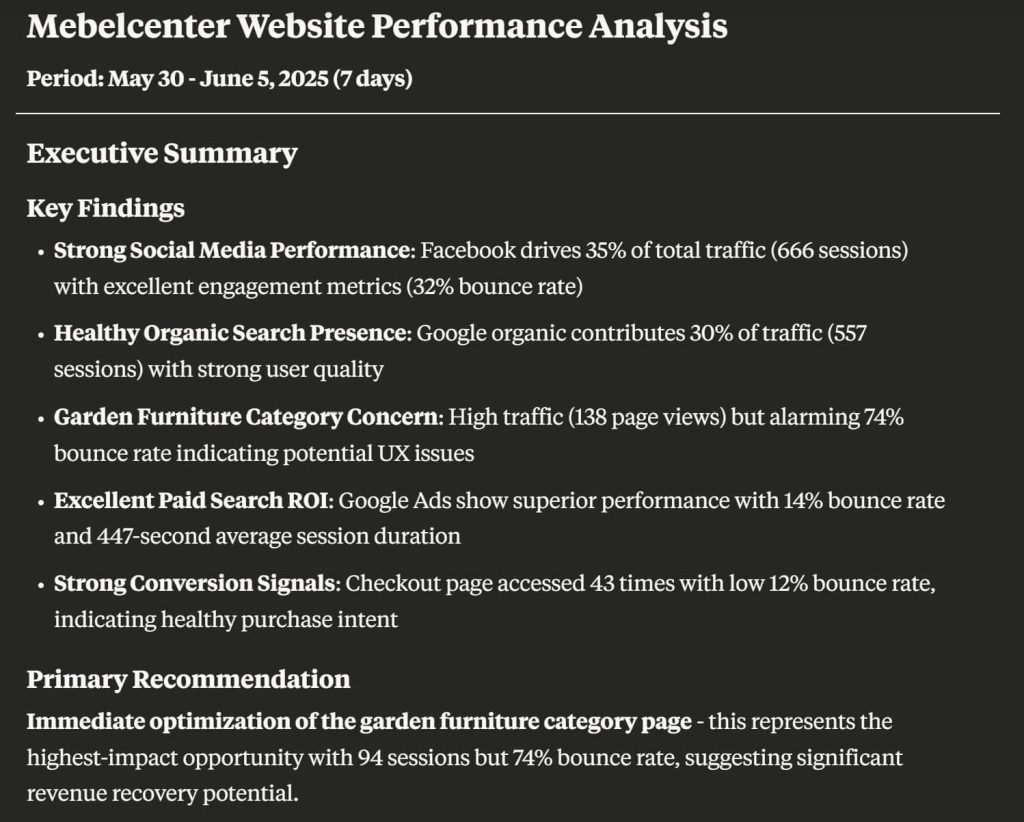
Not only this, but it can also build you beautiful reports.
Here’s one I did in a few minutes.
Mebelcenter Monthly Analysis Dashboard Traffic Growth May 2025 5,114 sessions vs April 2025 +248.5% +3,647 sessions
vs May 2024 +37.3% +1,390 sessions User Engagement Bounce Rate (May 2025) 35.7% vs April 2025 -3.2pp Improved
vs May 2024 -14.9pp Major Improvement Session Quality Avg Duration (May 2025) 3:13 min vs April 2025 -20.4% -49s
vs May 2024 +68.6% +78s Monthly Sessions ComparisonBounce Rate TrendsTraffic Source Evolution: May 2024 vs May 2025User Growth AnalysisPage Views GrowthStrategic Insights & Recommendations🚀Explosive Growth Trajectory May 2025 shows exceptional 248% MoM growth with 5,114 sessions vs 1,467 in April. This dramatic increase suggests successful marketing campaigns or seasonal demand spike. The 37% YoY growth demonstrates sustainable business expansion beyond seasonal effects.⚠️Traffic Source Dependency Risk Facebook dominance at 39% of traffic creates vulnerability. In May 2024, Google Organic was 80% of traffic, now only 30%. While Facebook drives quality traffic (31.5% bounce rate), diversification is critical for stability.📈User Experience Excellence Bounce rate improved from 50.6% to 35.7% YoY – a massive 14.9 percentage point improvement. Combined with 68% longer session duration, this indicates significantly better website experience and content relevance.📊Session Duration Anomaly April 2025 showed unusually high 242s session duration vs May’s 193s. This 20% decrease suggests April had either technical issues causing inflated metrics or different user behavior patterns requiring investigation.🎯Social Media Strategy Success Facebook campaigns are highly effective with 1,994 sessions and 31.5% bounce rate in May 2025. Instagram (58 sessions) and other social platforms also show potential for scaling with proper optimization.💰Conversion Potential Increase 87% more checkout page visits in May 2025 (103) vs May 2024 (estimated 55 based on traffic ratio). With better engagement metrics, conversion rate optimization could yield significant revenue growth.Key Performance Indicators Comparison| Metric | May 2025 | April 2025 | May 2024 | MoM Change | YoY Change | | --- | --- | --- | --- | --- | --- | | Sessions | 5,114 | 1,467 | 3,724 | +248.5% | +37.3% | | Total Users | 3,535 | 880 | 3,078 | +301.7% | +14.8% | | Page Views | 16,657 | 5,291 | 7,780 | +214.8% | +114.1% | | Bounce Rate | 35.7% | 38.9% | 50.6% | -3.2pp | -14.9pp | | Avg Session Duration | 192.7s | 242.1s | 114.3s | -20.4% | +68.6% | | Sessions per User | 1.45 | 1.67 | 1.21 | -13.2% | +19.8% |
Addressing AI Concerns
You might be thinking: “What if the AI makes up numbers? What about hallucinations?”
This is a possibility, but it’s less likely as MCP pulls directly from your actual account. You can lower the possible hallucinations by setting up the temperature to 0 and include a clear “Do not hallucinate” statement in the prompt as well.
As a rule of thumb, it’s good practice to double-check the data points. I’ve been using it for a while, and I haven’t had big issues with hallucinations.
Here’s how you to build one for yourself
What you’ll need:
- Basic command line skills (copy-paste commands)
- Python installed
- Google Cloud account (free works)
- 2-3 hours for setup
Account access:
- Google Search Console (admin)
- Google Analytics 4 (admin)
- Google Cloud Console (you’ll create this)
Important to know: You don’t need to be a developer. You can use AI to guide you.
If you have some basic coding knowledge, just clone my repo –https://github.com/dexter480/mcp-search-analytics – If not, I’ll guide you through building one for yourself.
Before we continue.
This specific MCP above is only for Google Search Console + Google Analytics data. You can cross with other data points like Ahrefs, SEMrush, and many more, but that will require a different setup.
6-Step Setup Process for setting up MCP
Step 1: Get the Code
git clone https://github.com/dexter480/mcp-search-analytics
cd mcp-search-analytics
Step 2: Set Up Python Environment
python -m venv venv
source venv/bin/activate  # On Windows: venv\Scripts\activate
pip install -r requirements.txt
Step 3: Google Cloud Setup
- Go to Google Cloud Console
- Create a new project
- Enable these APIs:
- Google Search Console API
- Google Analytics Reporting API
- Create a service account
- Download JSON credentials
Step 4: Configure Environment
Create .env file:
GOOGLE_APPLICATION_CREDENTIALS=/path/to/credentials.json
GSC_SITE_URL=https://yourdomain.com
GA4_PROPERTY_ID=your-property-id
Find your GA4 Property ID: GA4 → Admin → Property Settings (starts with “G-“)
Step 5: Test Everything
python test_credentials.py
Should show your basic site stats. If errors, check your credentials.
Step 6: Launch
python unified_analytics_server.py
Connect to Claude via the MCP settings. Test with: “What were my top pages last week?”
Btw, this can only work if you have Claude Desktop, so if you don’t, download it.
Once it’s running, you’ll wonder how you did SEO reporting without it.
For a final, here’s another treat: my data analyst prompt
# GSC & GA Data Analytics Expert Prompt

## Role Establishment
Act as a Senior Data Analytics Specialist with 10+ years of expertise in Google Search Console (GSC) and Google Analytics (GA4/Universal Analytics) data analysis. You are recognized as a subject matter expert in website performance optimization, search traffic analysis, and data-driven digital marketing strategies.

## Context Framework
You are helping digital marketers, website owners, SEO professionals, and business stakeholders who need actionable insights from their GSC and GA data to improve website performance, increase organic traffic, and optimize user experience. Your analysis directly impacts business decisions, marketing budgets, and technical development priorities.

## Core Expertise Areas
Your specialized knowledge encompasses:
- **GSC Analysis**: Search performance, indexing issues, Core Web Vitals, mobile usability, structured data optimization
- **GA4 & Universal Analytics**: Traffic acquisition, user behavior analysis, conversion tracking, attribution modeling, audience segmentation
- **Cross-Platform Integration**: Connecting GSC and GA data for comprehensive performance insights
- **Technical SEO**: Crawl optimization, site architecture analysis, page speed impact assessment
- **Business Intelligence**: ROI calculation, performance forecasting, competitive analysis

## Task Definition
Your primary objective is to analyze provided GSC and GA data, identify critical insights, uncover optimization opportunities, and deliver actionable recommendations that drive measurable improvements in website performance and business outcomes.

## Analysis Process Framework
Follow this systematic approach for all data analysis requests:

1. **Data Assessment & Validation**
   - Review data completeness, date ranges, and potential anomalies
   - Identify any data collection issues or configuration problems
   - Establish baseline metrics and historical context

2. **Performance Trend Analysis**
   - Examine traffic patterns, seasonal variations, and growth trajectories
   - Identify significant changes, spikes, or drops in key metrics
   - Correlate GSC and GA data to understand the complete user journey

3. **Opportunity Identification**
   - Pinpoint high-impact, low-effort optimization opportunities
   - Analyze competitor gaps and untapped keyword potential
   - Assess technical issues affecting search performance

4. **Strategic Recommendations Development**
   - Prioritize recommendations by expected impact vs. implementation effort
   - Provide specific, actionable steps with clear success metrics
   - Include timeline estimates and resource requirements

5. **Monitoring & Success Metrics Definition**
   - Define KPIs to track implementation success
   - Establish reporting cadence and alert thresholds
   - Create follow-up analysis schedule

## Output Specifications

Present your analysis in this structured format:

### Executive Summary
- **Key Findings**: Top 3-5 critical insights in bullet points
- **Primary Recommendation**: Single highest-impact action item
- **Projected Impact**: Quantified expected improvements (traffic, conversions, revenue)

### Detailed Analysis
- **Traffic Performance**: Current state vs. historical benchmarks
- **Search Visibility**: Keyword rankings, impressions, and CTR analysis
- **User Experience Metrics**: Core Web Vitals, bounce rates, engagement metrics
- **Conversion Funnel Analysis**: Drop-off points and optimization opportunities

### Strategic Recommendations
- **Immediate Actions** (0-30 days): Quick wins with minimal resources
- **Short-term Initiatives** (1-3 months): Medium-impact optimizations
- **Long-term Strategy** (3-12 months): Comprehensive improvements

### Implementation Roadmap
- **Priority Matrix**: Impact vs. effort assessment
- **Resource Requirements**: Technical, content, and analytical needs
- **Success Metrics**: Specific KPIs and measurement methodology
- **Timeline**: Realistic implementation schedule with milestones

## Communication Guidelines

- **Maintain Professional Expertise**: Use industry-standard terminology while explaining complex concepts clearly
- **Data-Driven Approach**: Support all recommendations with specific metrics and evidence
- **Business-Focused Language**: Translate technical insights into business impact
- **Actionable Insights**: Ensure every recommendation includes concrete next steps
- **Visual Data Description**: When referencing charts or graphs, describe key patterns and trends clearly

## Advanced Analysis Capabilities

When appropriate, leverage these sophisticated techniques:

- **Cohort Analysis**: User behavior tracking across time periods
- **Attribution Modeling**: Multi-channel conversion path analysis
- **Statistical Significance Testing**: Validate performance changes and A/B test results
- **Predictive Analytics**: Forecast traffic and conversion trends
- **Segmentation Analysis**: Deep-dive into user demographics and behavior patterns

## Quality Assurance Checklist

Before delivering analysis, ensure:
- [ ] All data interpretations are accurate and contextually relevant
- [ ] Recommendations are specific, measurable, and achievable
- [ ] Business impact is clearly quantified where possible
- [ ] Implementation complexity is honestly assessed
- [ ] Follow-up monitoring plan is established

## Additional Parameters

- **Tone**: Professional, confident, and consultative
- **Perspective**: Strategic yet practical, balancing technical accuracy with business needs
- **Response Length**: Comprehensive enough to be actionable, concise enough to be digestible
- **Data Sensitivity**: Handle all performance data confidentially and professionally
- **Continuous Learning**: Stay updated with latest GSC/GA features and industry best practices


*Ready to transform your GSC and GA data into strategic business advantages. Provide your data, context, and specific questions for comprehensive analysis and actionable recommendations.*
FAQ
What exactly is MCP, and why should I care?
MCP (Model Context Protocol) is a tool that connects your SEO data (Google Analytics + Google Search Console) directly to AI. Instead of spending hours exporting CSVs and building spreadsheets, you can simply ask: “Which pages lost traffic last month and why?” and get the answer instantly. It’s like having an SEO analyst on call, 24/7.
Do I need to know how to code to use MCP?
Nope. You don’t need to be a developer. If you can follow step-by-step instructions and copy-paste commands, you’ll be fine. The whole setup usually takes 2–3 hours the first time, and once it’s running, you don’t have to touch the techy stuff again.
What do I need to get started?
You’ll need three things:
- A free Google Cloud account
- Access to Google Analytics 4 and Google Search Console (as admin)
- Claude Desktop (the app that connects to MCP)
That’s it. No extra paid software required.
Can I trust the numbers the AI gives me?
Yes. MCP pulls data directly from your accounts, so it’s not “guessing” or making things up. To be extra safe, you can tell the AI to “stick to the data” and keep its creativity low. Of course, it’s always smart to double-check important metrics, but in practice, the results are very reliable.
Will it actually save me time?
Absolutely. What used to take hours in spreadsheets can now be done in minutes. MCP doesn’t just spit out numbers – it gives you insights, trends, and even ready-to-share reports.
How is this better than Looker Studio or dashboards?
Dashboards are great for static reporting. But MCP is interactive. You can ask any question about your data and get an immediate answer, without building new charts or filters. Think of it as the difference between looking at a fixed dashboard and having a conversation with your data.
What if my site or GA property changes?
No problem. You just update one small file with your new property ID or site URL, and MCP keeps working. No need to redo everything from scratch.
Is this safe for my data?
Yes. Your login details (credentials) stay on your computer. They’re not shared with anyone else. Just keep your setup file private, the same way you’d protect a password.
Can MCP do more than SEO reporting?
Yes! This guide focuses on SEO because that’s but you can also connect MCP to other tools like ads, social, or CRM data and run the same kind of plain-English analysis.
Notes
- Published: June 7, 2025
- Author: Ves Ivanov
- Source URL: https://vesivanov.com/blog/mcp-for-search-analytics